⛳ Nyanga is situated in or near the subtropical dry forest biome.
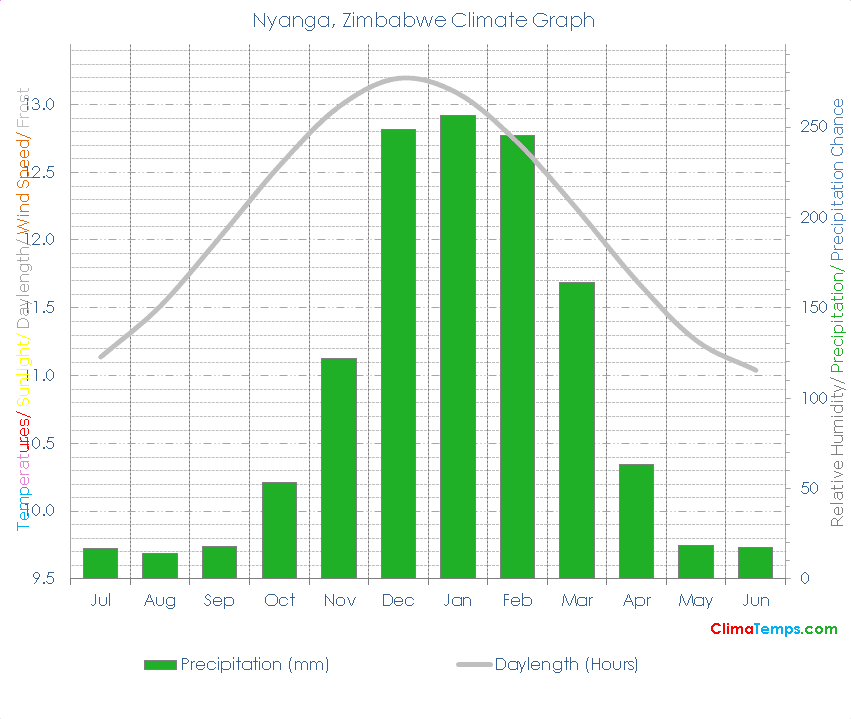
☔ Total annual precipitation averages 1236.7 mm (48.7 inches) which is equivalent to 1236.7 Litres/m² (30.33 Gallons/ft²).
Simply paste the following HTML code into your webpage. Please include a link back to this website. There is one in the following code already. Edit the width attribute to change the size of the graph if needed:
✨ The longest day of the year is 13:05 long on the 21 of December and the shortest day is 10:54 long on the 22 of June.
🐇Were you to burrow down through the centre of the Earth from Nyanga you would pop up nearest to the climate station at Hilo, (Big Island), Hawaii, Hawaii where you would find a Tropical wet climate (Subtropical dry forest biome).
🌍Nyanga, Zimbabwe is at 18°16'S, 32°45'E,
| Climate Variable | Jul | Aug | Sep | Oct | Nov | Dec | Jan | Feb | Mar | Apr | May | Jun | Annual | ||
|---|---|---|---|---|---|---|---|---|---|---|---|---|---|---|---|
| Average Precipitation mm (in) | 17 (1) | 14 (1) | 18 (1) | 53 (2) | 122 (5) | 249 (10) | 257 (10) | 245 (10) | 164 (6) | 63 (2) | 19 (1) | 17 (1) | 1237 (49) | ||
| Average Daylight Hours/ Day | 11h 08' | 11h 30' | 12h 01' | 12h 32' | 12h 59' | 13h 11' | 13h 04' | 12h 43' | 12h 13' | 11h 41' | 11h 15' | 11h 02' | 12h 00' | ||
| Sun altitude at solar noon on the 21st day (°). | 51.3 | 59.6 | 71 | 81.6 | 86.3 | 84.8 | 86.9 | 81.6 | 71.4 | 59.8 | 51.5 | 48.3 | 69.5 |
Please take a moment to share a climate graph or simply the address:
Thank You, so much! ❤️